SEO
Free SEO Analysis
SEO Services
Content Marketing Services
Local SEO
Link Building Services
Specialized SEO Services
PPC
REPUTATION MANAGEMENT
Free Reputation Management Analysis
Reputation Management Services
Review Management Services
Specialized Reputation Management Services
CEO Reputation Management
Brand Enhancement
Business and Directory Listings
Comprehensive Reputation Management Audit
SOCIAL MEDIA
Free Social Media Analysis
Specialized Social Services
WEB DEVELOPMENT
Free Website Analysis
Web Design Services
Mobile Development Services
Website Maintenance Services
Specialized Development Services
MARKETING AUTOMATION
Free Marketing Automation Analysis
Specialized Marketing Automation Services
Comprehensive Marketing Automation
INDUSTRIES
ABOUT DMA
Web Development
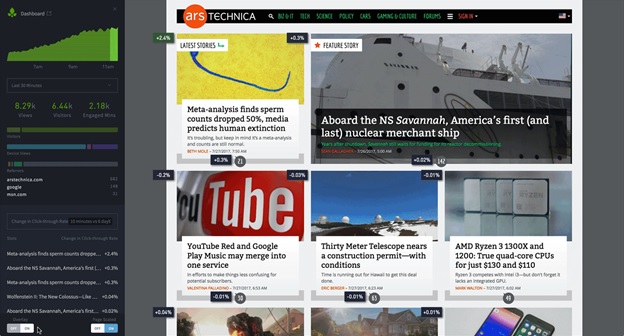
Heatmaps: Benefits and Common Issues for Website Optimization
Request a quote
Its Fast, Easy & Free
Executive Summary
- Experts in website optimization refer to heatmaps as a form of visual storytelling.
- Beside classic heatmaps only show the activity of visitors in regard to clicks and mouse movements, there are other heatmaps available.
- Website visitors often read content in an F-shaped pattern. There are many studies that prove this skimming nature of online reading. So make sure to have powerful headlines and subheadlines in your blog posts.
The top goals of website optimization are to make it more appealing to website visitors, improve user experience, and increase conversion rates. But when it comes to optimization, the main problem is knowing where to start. This problem leads to more, such as knowing what should be changed and what should remain intact.
This line of problems can move us further down the spiral of inaction and confusion. This is where heatmaps jump in as a heroic savior. Let’s see what heatmaps are, how they can kickstart website optimization, and what issues you can expect during a heatmaps-driven optimization process.
What are Heatmaps?
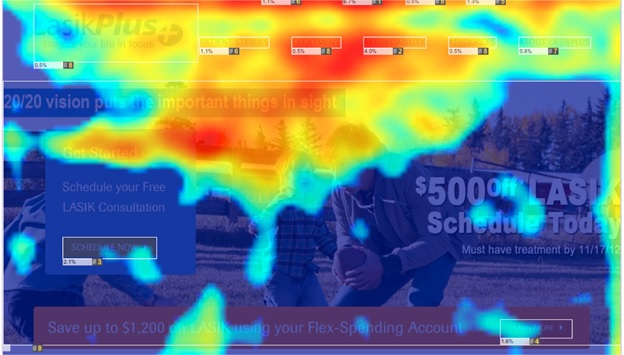
You’ve probably heard about heatmaps before, and you know they have something to do with website optimization. In fact, heatmaps are used to shine light on how website visitors interact with each web page of your website. And, while we are at it, heatmaps are the most effective method to help you with this.
If you use heatmap software, you’ll be able to see in great detail where your visitors’ clicks land. Additionally you will be able to identify the web pages and the elements on those pages that get no clicks.
Heatmaps are also able to help you see what visitors look at on your website. This is because heatmap software tracks the visitors’ mouse movements. It’s like having a GPS locator attached to each visitor’s mouse, constantly logging their behavior.
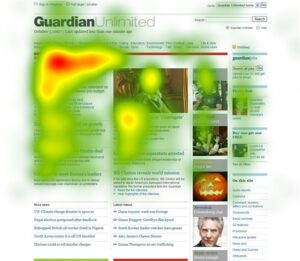
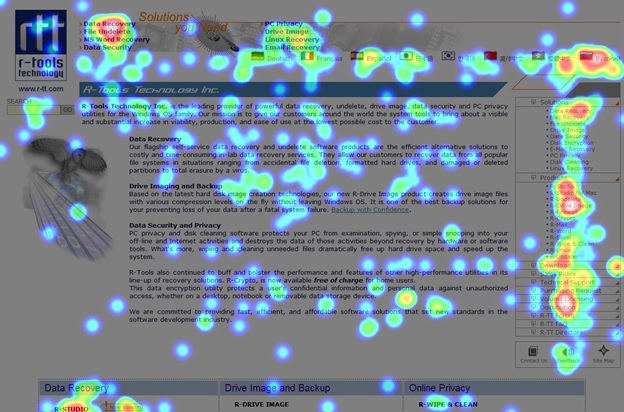
By utilizing colors, heatmap software generates a visual report that represents the activity of website visitors. These reports are very easy to read. Frequently used colors are reds, oranges, greens, and blues. Reds and oranges are used to mark the areas that users frequently interact with, whereas greens and blues are used to highlight areas or elements with the least interaction potential.
It’s not by chance that experts in website optimization refer to heatmaps as a form of visual storytelling.
How Heatmaps Work?
Heatmapping is not a new method in data processing and representation. It is an old statistical analysis technique that dates back to the 19th century. They are suitable for representing complex data because heatmaps are easy to read and understand, unlike charts and tables.
The first step in creating a visual representation of analytic data is map creation. The web pages you want to get analyzed are divided into elements that may be interacted with. The elements are grouped by their tags and bigger elements that contain them, the so-called parent elements.
When the mapping is complete, heatmap software starts to track and record website visitors’ activity. Every visitor’s activity gets flagged and stored in the database. This software makes sure that it only tracks activity of unique visitors, so you get the most accurate data.
The activities are recorded in real time and the reports are generated in the same fashion. Whenever you view the report, you will be able to see the most recent data, which makes heatmaps an incredibly valuable tool to track the effectiveness of website changes and tune-ups.
Types of Heatmaps
Beside classic heatmaps only show the activity of visitors in regard to clicks and mouse movements, there are other heatmaps available.
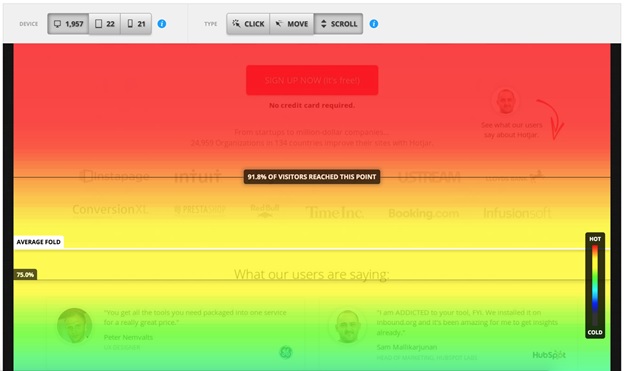
Scroll map – Did you ever wonder whether you should go with shorter or longer content? Where should you place your call to action (CTA)? Well, a scroll map can help you with that. Scroll map reports show you the proportion of scrolls performed by the visitors before they decided to leave the webpage or website.
Scroll maps can help you identify the perfect content length or the placeholder for your CTA. Scroll map reports also contain colors. A sudden change of coloring indicates that the visitor has come to a logical end — a section of the website where they no longer see a logical reason to continue scrolling.
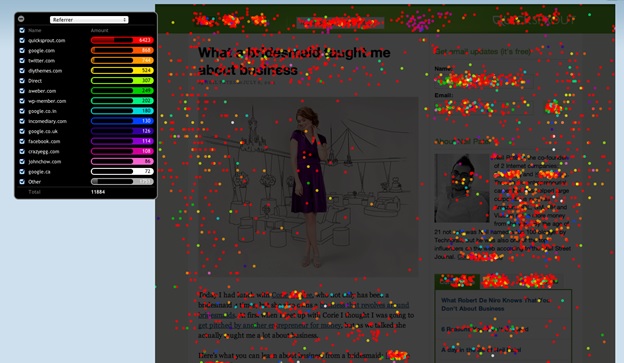
Confetti (click) map – The confetti map is an advanced version of the common heatmap. The confetti map report is generated in high-resolution. This is because it contains individual clicks of website visitors. These clicks are represented by colored dots.
With a confetti map, you can identify non-clickable elements that users still click on. These elements are the ones that frustrate the visitors, causing them to leave your website. With this data, you can improve the navigation of your website and give users what they want.
Overlay map – In the overlay map report, you will be able to see percentages of clicks per each element on your website. The overlay map shows the performance of each element individually. These reports provide quick insights. They are very useful if you want to quickly check how different elements are performing after you’ve made subtle changes to your website.
Hover maps – Hover maps are a representation of mouse movement data. They highlight the areas of a webpage that have been hovered over by a visitor’s mouse. Hover maps will help you see how visitors read your web pages.
Attention maps – If you want to see which elements of the webpage are the most attractive to your visitors and therefore grab the most attention, attention map reports can help you. The metrics that come into the equation are: The most-viewed web page elements, how far the users scrolled, and time spent on the page. If you want to optimize your website with your visitors in mind, attention maps are designed to be your perfect guides.
Benefits of Using Heatmaps
Every website is generating traffic, and each website element contributes to traffic generation. If you want to see which elements are performing as intended and identify those that are underperforming, heatmaps are your best friends.
By improving the performance of individual elements, you will improve the performance of the website as a whole — generate more traffic, improve conversion rates, and increase the time users spend on your website.
Here are the major benefits of using heatmaps:
Website usability testing – With heatmaps, you will be able to see which functions of your website visitors use the most and which are obsolete. If you improve the functionality of the frequently used elements on your website, you will automatically increase the usability of your website and improve user experience overall.
The elements that don’t get visitors’ attention can either be removed to clear the layout of your website and improve website loading speed or revisited and made more attractive. For instance, if you identify the element with no functionality that is being clicked on, consider adding some functionality to it, and remove elements that generate no attention.
Ad Placement and Optimization – Attention maps are great when it comes to identifying the most attractive elements on your website. If you want to display ads on your website, you should place them in the sections of the layout that grab the attention of your visitors.
This is extremely important if you are in the affiliate marketing business. By utilizing attention maps, you will be able to increase the conversion rates and return on investment (ROI). On the other hand, if you see that ads are exactly where they need to be but they are still not grabbing attention, you should optimize them. Consider changing the ad picture and text so it fits the theme of your website.
Link placement – Do you want to get more clicks on the links you have placed in your blog post? You won’t get any if they are beyond the logical ends on your web pages and blog posts. Utilize scroll and hover maps to see whether visitors are even considering clicking on the links. Relocate them and change the anchor text to improve the link’s performance.
CTA placement – CTA placement is one of the most explored practices in website optimization. Nevertheless, after you have respectfully followed the best practices, revisit the heatmaps to see what’s going on with your website visitors and CTA. You may still need to make small adjustments to meet the expectations of your audience.
You can use confetti (click) and overlay maps to identify distracted clicks. You have to make sure visitors are focused on a clear CTA. By removing the distracting elements from the picture, you will increase CTA performance.
If you didn't use a CTA before, you can find its sweet spot by reviewing the attention maps. Identify the element that grabs the most attention and place your CTA text and button directly below or above it.
Optimization of online forms – If you’re using forms on your website, it’s important to make sure they are not affecting the overall user experience. With heatmaps, you can identify the fields that are causing the visitors to bounce off your website and make specific adjustments to prevent this from happening again.
With heatmaps you can identify the fields that are causing the visitors to bounce off your website and make specific adjustments to prevent this from happening again.
If your online form is not grabbing enough attention, you can use scroll and attention maps to find a perfect spot for it. Since heatmaps record data for each element, you can use the reports to see how individual elements of an online form perform.
You can use this to improve form titles, form CTA button and text (Click Here, Go, Submit), number of fields, number of optional fields, etc. Besides, you can track the effect of each change and make subtle tune-ups with minimal risk to user experience.
Ecommerce shopping cart optimization – Cater to the visitors who are on the shopping cart page. They are ready to buy, so make this process as smooth as possible and optimize the page to convert better.
Heatmaps can help you position the important elements so they’re more visible. For instance, check the performance of the free shipping banner, position of the Buy/Checkout button and irrelevant elements that grab the attention of the customers.
Every time you make a change, be sure to see how it affected the user interface and experience by reviewing newly generated heatmaps.
Heatmap Software
There are many heatmap tools available on the market. They are easy to use and the reports they generate are easy to interpret. The best ones are designed to be used by people with no extensive technical background.
Here are the best and most commonly used heatmap tools. Make sure to get familiar with the ease-of-use features for each of these tools before you decide to use them.
ClickTale
Clicktale is one of the most popular heatmap software tools. You can get insights into numerous heatmap types and use them to make improvements to your website.
One feature that make the Clicktale tool unique is user activity recordings. These recordings are delivered as video files, enabling you to analyze mouse cursor movement in great detail and understand how and why visitors behave in a specific way.
Clicktale also generates valuable reports on online forms. In addition, it offers a real-time view into visitors’ activity. One interesting feature is the Cursor Engagement. It will allow you to see whether the links visitors open further engage them or leave them unimpressed and idle.
Unlike similar software tools on the market, Clicktale does have a steep learning curve and it will take you some time before you’re completely confident using its most powerful features.
Hotjar
While it may be the youngest competitor on the heatmap software market, Hotjar comes with a lot of features and great functionality. It is designed as a cross-platform tool able to generate a wide range of reports, not just heatmaps. If you opt for this solution, you will be able to see detailed heatmap and scroll map for each web page on your site.
Beside the standard heatmap report, you can use Hotjar to review visitor mouse behavior recordings, get insights from performance and conversion reports, and use it to launch surveys and feedback pools.
One downside of Hotjar is that it only tracks and records 2,000 sessions before it generates a heatmap. While this makes it suitable for websites with lower amounts of traffic, this tool is not a good option for websites with high traffic.
Crazy Egg
Crazy Egg is a powerful heatmap tool. It is used and recommended by many experts in the website optimization niche. This software generates a heatmap report on top of the screenshot of the web pages you enable it on. These types of reports are insightful, as you can clearly see the performance of each element in the page layout.
This tool also incorporates some of the features of the popular Google Analytics. It generates various reports on website visitors: country of origin, device used for browsing, and other relevant metrics.
It is an easy-to-use tool with an intuitive and simple user interface. You don’t need any previous knowledge to know how to operate its features. The only problem is the price. If you decide to go with Crazy Egg, you will have to commit to any of the offered plans for an entire year.
Common Issues
While the heatmap tools and heatmaps are valuable assets in the website optimization process, there are some issues that may arise. Fortunately, these problems can be prevented with research and detailed planning.
Committing to a heatmap software tool before establishing a goal is the most common issue that comes up when you see the heatmap report for the first time. The question that might kick in at this point is: “What now?” This is why you have to define website optimization goals before you start.
If you want to increase website traffic, the last thing on your list is heatmap analysis. For this purpose, you want to consider developing an SEO and social media marketing strategy. On the other hand, if you want to find a reason behind the high bounce rate, heatmaps are the best solution.
The breadcrumbs that you have to follow:
What do you want to improve on your website?
Which metric is equivalent for that improvement?
What is the best method?
If heatmap software is what you need, which heatmap type will work the best?
When you identify the problem and implement a solution, test it.
Repeat the process until you are satisfied with the result.
A heatmap is just one website optimization method. When paired with others, it delivers astonishing results. So try not to solely depend on the heatmap reports. Understanding user behavior and successfully catering to it are two completely different things. Stay on top of your game and make sure to follow the best website optimization and user experience practices.
What Has Heat Mapping Taught Us So Far?
Experts have been using heatmaps for a long time now. Here is what they’ve learned so far:
In most cases, a website visitor's attention is aimed at the left side of your website. So make sure to use elements located on this side to convey your message more effectively.
Website visitors often read content in an F-shaped pattern. There are many studies that prove this skimming nature of online reading. So make sure to have powerful headlines and subheadlines in your blog posts.
If you're using images of people on your website, make sure they look at the content you want your visitors to read. Heatmaps studies have shown us that people often follow the eye direction of the person in an image.
Color contrasts are powerful road signs that will guide your visitors' attention across the website layout.
Your most important content should be located at the top of the web page. Visitors pay the most attention during the first few seconds of arriving on your website. Use this information to deliver the most important information first.
Heatmapping is definitely the most powerful method when it comes to discovering visitors’ behavior patterns and distinguishing high- from low-performing web page elements. Once you learn how to read a heatmap, you will be able to fine-tune your website design to maximize the user experience, increase conversions, and make your visitors to want to stay longer.
In the end, if you decide to use heatmaps to custom-tailor your website to your audience, make sure to follow the steps from the “Common issues” section. In many cases, heatmaps will pinpoint the problem for you, but you will still have to consult a professional to get the most out of the website optimization process.
Our Sales team
We are available for you every time
