SEO
Free SEO Analysis
SEO Services
Content Marketing Services
Local SEO
Link Building Services
Specialized SEO Services
PPC
REPUTATION MANAGEMENT
Free Reputation Management Analysis
Reputation Management Services
Review Management Services
Specialized Reputation Management Services
CEO Reputation Management
Brand Enhancement
Business and Directory Listings
Comprehensive Reputation Management Audit
SOCIAL MEDIA
Free Social Media Analysis
Specialized Social Services
WEB DEVELOPMENT
Free Website Analysis
Web Design Services
Mobile Development Services
Website Maintenance Services
Specialized Development Services
MARKETING AUTOMATION
Free Marketing Automation Analysis
Specialized Marketing Automation Services
Comprehensive Marketing Automation
INDUSTRIES
ABOUT DMA
SEO
How to Use Analytics Without Losing Your Goals in All the Numbers
Request a quote
Its Fast, Easy & Free
Executive Summary
- If you are an absolute beginner in Google Analytics, it is advised to start with standard ecommerce reports.
- Google is always working on improving their analytics tool. As a result, there are many versions of the Google Analytics code (tracking ID) you can use. Make sure you're always using the latest one.
- One of the most common errors associated with using Google Analytics is campaign tracking.

Google Analytics is a powerful tool used for both marketing purposes and search engine optimization (SEO). You’ve likely heard about it before and you might have it on your official website.
Once you log in to Analytics, you are presented with an intimidating user interface. There are numerous tables, charts, and metrics, and each of them hides useful data that you can immediately act upon. The question is, how do you use all those statistic and analytic tools to improve your online efforts, including user experience, conversions, website content, and online marketing campaigns?
Getting ahold of all the data gathered and analyzed by Google Analytics is a daunting task even for more advanced and experienced users. There is too much room for making mistakes and oversights. This is why we have put together a list of tips and tricks that will help you use Analytics without losing your goals in all the numbers. So, let’s jump straight into it.
Take Precautions - Use the Latest Code
Since you will be taking actions based on data insights, you have to make sure that you’re using the latest Google Analytics code. You don’t want to base your actions on incomplete or potentially false data.
Google is always working on improving their analytics tool. As a result, there are many versions of the Google Analytics code (tracking ID) that you have to insert in your website’s pages. Using the latest one is of the utmost importance, along with pasting it on all pages you want to track.
Once you have signed into your Analytics account, you can check if you are using the latest code by clicking on Admin. In the Account column, select your account and, from the Property column, select a property. In the Property tab, you should select Tracking Info and then Tracking Code. Make sure that the tracking code displayed at the top of the page is the same as the one you have embedded in your website’s HTML.
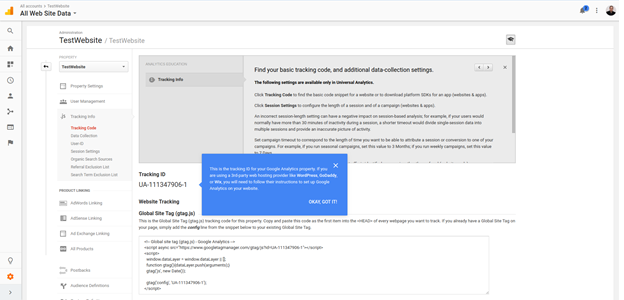
To make sure that your tracking ID is working, go to your website and then switch back to Google Analytics to access real-time reports. If your visit has been logged, everything is fine.
Common error: Double tracking - When you want to update your track ID code on the pages of your website, make sure to delete the legacy code (the one that was in use by that moment). By doing so, you will avoid the Double tracking error - the tracking ID triggering twice when the page loads, feeding you false (x2) data.
Understand the Basics
In order to know where you can find what you are looking for, you have to know the basics. Here is how the homepage of the Google Analytics dashboard looks like and what each key section contains.
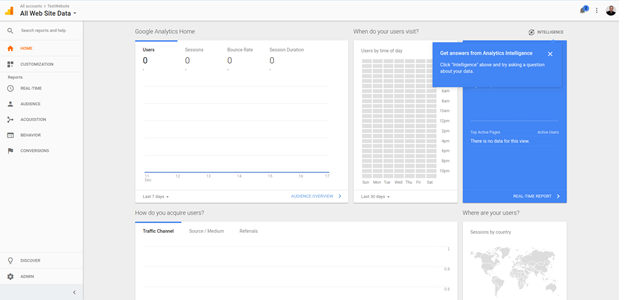
Real-time - In this tab you can monitor your website visitors’ activity on your website in real time. The data is updated every few seconds. You can see the total number of people currently on your website, their geolocation, what are the websites or keywords that got them here, which webpage are they currently on. You can see conversions as they take place in real time, too.
Audience - In this section, you can determine who are your website visitors and what are their preferences. Additionally, you can discover which devices they are using and where do they live.
Acquisition - In this tab, you can learn how your visitors are discovering your website. What are the specific locations online that have brought them here. And, what's most important, are your campaigns bringing them to your website.
Behavior - This tab can provide you with information on what visitors are doing once they arrive on your website. You can see which pages they visited and what actions they took on each of them.
Conversions - In this tab, you can see if your goals (when it comes to the visitors’ behavior) have been achieved. Are they subscribing to you emailing list? Are they getting that free ebook you have on offer? Are they buying the items you are promoting through your campaign?
Analytics KPIs and Goals
People and businesses decide to create and publish websites for a number of reasons. So, first, you have to write a list of your goals. To help yourself with this, ask yourself a simple question - “Why did I create my website in the first place?”.
Once you clearly establish your goals, which may go from increasing brand awareness and establishing yourself as an expert in the industry to selling products online and educating the audience, you are ready to dive into the data. For instance, if you want to increase brand awareness, you will be interested in website traffic and the average time of visitor sessions. On the other hand, if you are interested in selling more products, you will monitor conversion rates, the total number of site sessions and your revenue.
All of these are your Google Analytics key performance indicators (KPIs). Now, instead of losing precious time jumping from tab to tab, you should make your customized Google Analytics dashboard. The goal is to create your custom dashboard which contains your personal KPIs. By doing so, you will be able to monitor only the data relevant to your goals and identify trends as they come along.
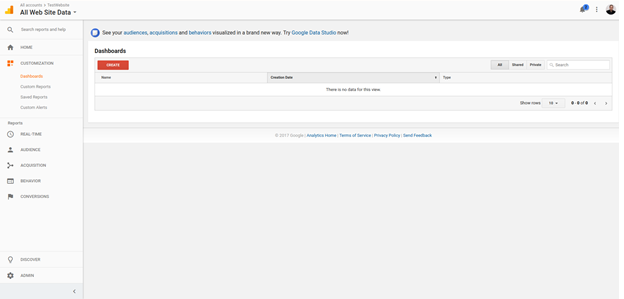
While logged into Google Analytics, click on Customization on the left of your Home screen, navigate to Dashboards and click on the Create button. You can either get your own thing going or use some of the pre-configured Starter Dashboards.
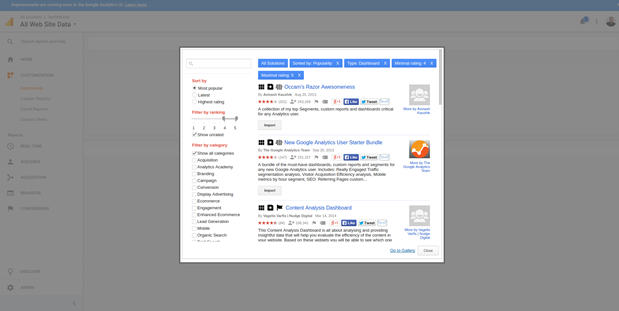
If you are less experienced with building dashboards, we recommend that you take one of the Starter Dashboard packs. After you click the Import from Gallery button, you will be able to choose the one that contains KPIs that align with your business goals.
Having your KPIs sorted out in this fashion will help you gain powerful insights with only one screen glance. If your goals change, you can easily modify your dashboard to get rid of obsolete data and get new valid KPIs in front of you.
When in Doubt, Fall Back to 3 Basic Metrics
If you find all these numbers too confusing, you should remember that this analytic tool is here to tell you how your website is performing and what you need to change. And, you can find this out by looking at Average Time on Page, Referrals and Interests.
Channels - this is a metric that can show you how your campaigns are performing and whether your blog posts are picking interest from other webmasters who are linking them or mentioning them on their websites or social media. So, when you go to Acquisition > All Traffic > Channels, you will be able to see a table with all the information necessary. Since we will cover campaigns in one of the following channels, lets see how to leverage the referral metric.
When you click on the Referral metric, you will be able to see the origin of your inbound traffic. You will be able to identify the type of content that results in the most referrals. So, make more of it!
Interests - in order to attract more visitors to your website and to build better connections with the current ones, you should always be looking at Interests. Click Audience > Interests and then on Overview from the drop down menu.
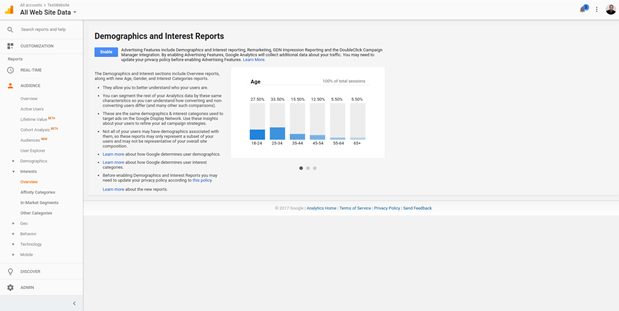
In the right tab, you will be able to discover a lot about your website visitors. Among other data, their interests too. In the Affinity Category, you will find out what their hobbies and interests are. The In-Market Segment category holds information that will help you discover what your website visitors are interested in buying. Lastly, the Other category will show you other interests of your website visitors.
Interests is a metric that can help you deliver a better user experience to your website visitors, whether you are running a tech blog, an ecommerce website or an elearning website. When you know the interests of your audience, you can custom-tailor your content and website in general to provide them with exactly what they need.
Average Time on Page - To access this metric click on the Behaviour > Overview. Import the Content Efficiency Analysis Report and you will be able to see this metric for each of your website pages. This metric shows you how interesting the content you are offering is and if the visitors find it engaging.
While you are at it, make sure to identify the pages with the highest and lowest performance in this category. See what they have in common and then try to provide a consistent experience throughout your website.
By keeping close tabs on these three metrics, you will be able to draw actionable insights from your data with your business goals in mind. There are only a few numbers to look at so you won’t be able to get confused, especially now, when you know a lot of whats and hows.
Make Sure to Track Your Campaigns
One of the most common errors associated with using Google Analytics is campaign tracking. Before we begin, it is important to understand that you can track both your online and offline campaigns by using this tool.
Online Campaigns
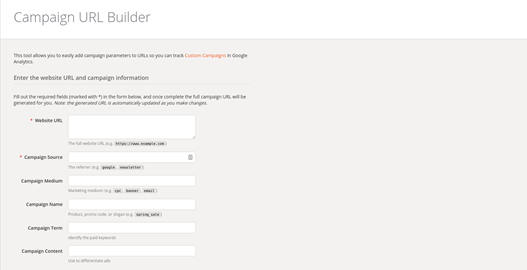
In order to discover the most effective ways to attract more visitors to your website, you absolutely have to use custom campaigns. Google Analytics can show you precisely where your visitors are coming from if you use the Google URL Builder Tool. WIth this tool, you will be able to add extensions to the URLs (utm_source, utm_medium, utm_campaign, and so on) in your campaign to see which ones are generating more traffic.
To get your custom URLs, you will have to use the Campaign URL Builder. This is a straightforward tool to use. Check the interface in the picture below.
To be absolutely sure that your campaign tracker works correctly, make sure to:
Use Google’s URL Builder;
Double check your custom URL. The one the builder tool has generated has to be the same as the one used in your project.
After you are done, go through it once again just to be sure. Enter URLs and check if the generated ones are matching the ones you have already pasted.
If you are using paid ads on Social Media, make sure to use modified URLs when you are building an advert.
Offline Campaigns
Offline campaigns are promotions via newspapers, outdoor hoarding, TV, and other. If you don’t track these, you won't be able to assess how efficiently you are spending your hard earned bucks. Now, while it is hard to track offline efforts by using an online tool, it is not impossible.
When you launch and offline campaign, you can experience a spike in website traffic. Your logical reasoning would be that it is the consequence of your offline marketing efforts. But in many situations, this is not entirely true. And, it would be better to see the precise effect your offline marketing has had on your website traffic and revenue. It does sound awesome, but how to do it?
In order to record offline campaign referral visits, you will have to use a discount code. This way, you will know exactly how many visitors have come to your website after checking your offline campaign.
Besides using a coupon or discount code, you can use a unique URL in your offline campaign that leads to a landing page. By doing so, you will be able to see how much traffic is directed to your website via a specific advert and the exact conversion rate of that particular advert.
One more trick to pull off is to redirect that custom URL to a custom built URL which you can use in a custom campaign. Just like in the example above, only make sure that this redirect is permanent.
Tip for beginners: If you don't want to lose your goals in all the numbers returned by campaign reports, you can use premade campaigns from the Google gallery.
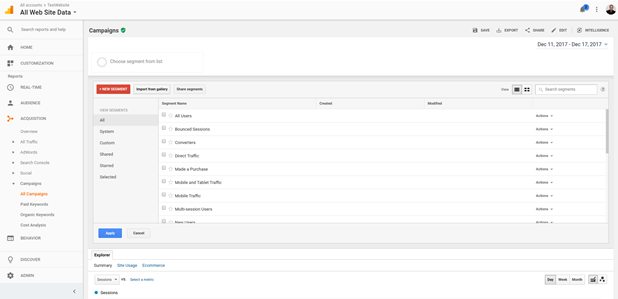
Click on Acquisition on the left of your dashboard. Navigate to Campaigns and pick All Campaigns from the drop down menu. In the right section of the screen, you will see a Import from gallery button right next to the NEW SEGMENT (red) one. Click on it and you will be able to use campaigns premade by experienced users and analytic firms.
Be Aware of the False Data
We live in an era of online bots, spammers and crawling spiders. These artificial website visitors may trick Google Analytics to feed you with false data. Using this data to draw insights may cause you to pull wrong moves in regards to your online marketing efforts. Don’t worry though, as there are tricks that will help you to filter false data out.
A good start would be to enable protection from all known bots and spiders. This option is built in Google Analytics. Click on the Admin label located on the bottom left part of the screen. This will open a new tab in the right section of the screen, where, under View, you should click on View Settings. In the right portion of the screen, scroll down and check the box “Exclude all hits from known bots and spiders”.
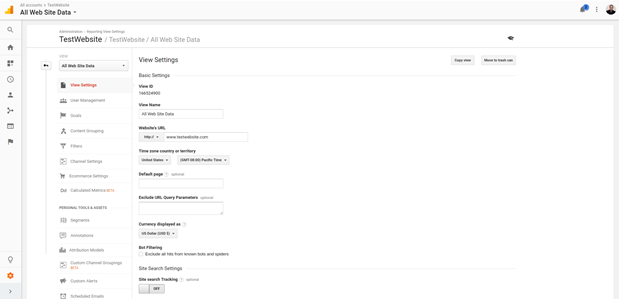
Make sure to create a New View and apply this setting to it. This way. you can see to what extent the data has changed.
Additionally, If you see a big chunk of traffic originating from a single IP address in the report tool, you can block it. This setting is for those of you who are the code-savvy type. You can find instructions on how to do it here.
The easiest way to do this is to implement reCAPTCHA and email verification methods on your website. The newest version of reCAPTCHA makes sure that the user is a human by tracking subtle mouse pointer moves on the screen. Restrain from using those on the homepage though, as it will affect the user experience. Email verification is great when you want to build an emailing list.
There is other trouble with data that may cause you to think that your site is not performing so well - Bounce Rate. You can access this chart by clicking on Audience > Overview, and then selecting “Bounce Rate” from the drop down menu on the right portion of the screen - right above the graph.
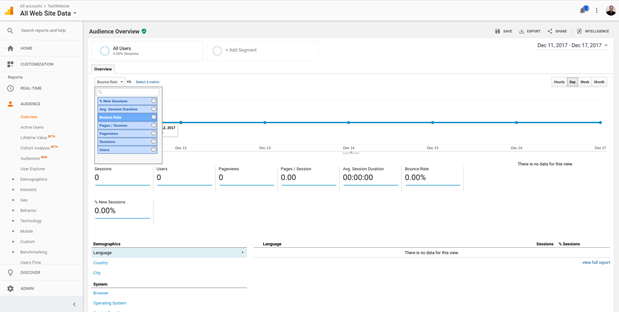
The expected bounce rate should go between 50% and 80%, and this is considered normal. If you see it below 25%, or even worse, in single digits, you have to check a few things. Make sure that you don't have a few instances of the Google tracking code pasted on your website pages. This quite frequently happens to WordPress users, if both the theme and the SEO addon insert a code snippet of their own.
If you are inserting the Google tracking code snippet, make sure that somebody didn't insert the Google Tag Manager tracking code. The result is the same, all the metrics will be doubled up or down. And, lastly, if you use some sort of popup on your website, make sure to set it as a non-interaction event, so it doesn't affect your bounce rate metric.
You should do this for all downloads and embedded videos on your website too, because they are by default regarded as bounce off events by Google Analytics. In this particular event, the non-interaction setting should be set on “true”.
Standard vs Enhanced Ecommerce Reports
If you are an absolute beginner in Google Analytics, it is advised to start with standard ecommerce reports. These will provide you with more than enough data to draw powerful insights and make proper adjustments to your digital marketing efforts and ecommerce website.
After you import a premade dashboard for ecommerce by following the steps we have already covered, you will be able to see these standard ecommerce reports.
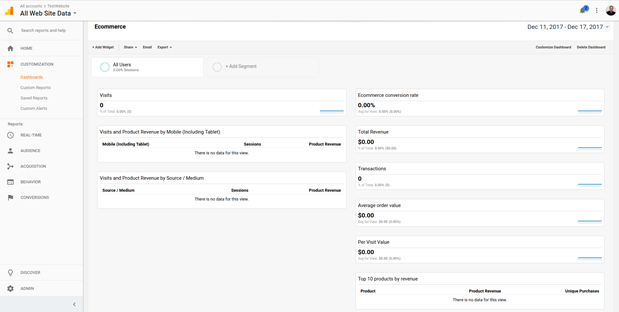
Standard ecommerce reports include:
Overview: Total Revenue, Conversion Rate, Average Order Value, Number of Completed Transactions, etc.
Product Performance: Average Price, Revenue, Quantity, Number of Purchases and other metrics for each product.
Sales Performance: Revenue Calendar Spreadsheet
Transactions: Shipping, Tax and Revenue
Time to Purchase: Number of Sessions to Transaction and Days to Transaction
These are more than enough to discover trends in your market. You can see which products are hot and compare those against your audience to discover other relevant products that you can sell.
You can optimize quantity discounts to increase the number of products per transaction metric, if you find it to be too low. Furthermore, if you take a close look at the Number of Sessions to Transaction and Days to Transaction, you can identify trends in your customer purchasing decisions and make adjustments to your website accordingly. For instance, you can make it easier for them to reach products, link products or product categories in articles on your blog, and so on.
Enhanced Ecommerce reports include shopping and purchasing behavior, economic performance, merchandising success and product attribution. You can find more information on those by viewing official Google Analytics docs.
While intimidating at the start, the Google Analytics tool looks so harmless and easy to use after we have dissected it for you. As you can see, this tool packs a great amount of power, especially to those who are motivated to learn it’s features and how to read the data it feeds back. Keep in mind, though, that we have barely scratched the surface of this tool’s potential. If you want to learn more, feel free to consult official Google Help Center Docs and relevant and authoritative blogs.
Our Sales team
We are available for you every time
